Shopify’s built-in analytics tools help over 1 million merchants make data-driven decisions. According to Shopify’s 2023 Commerce Trends Report, businesses using analytics effectively see 23% higher conversion rates than those relying on guesswork. For beginners, understanding Shopify Reports & Analytics is crucial for tracking store performance and identifying growth opportunities.

Navigating Shopify Analytics Dashboard
Key Sections to Explore
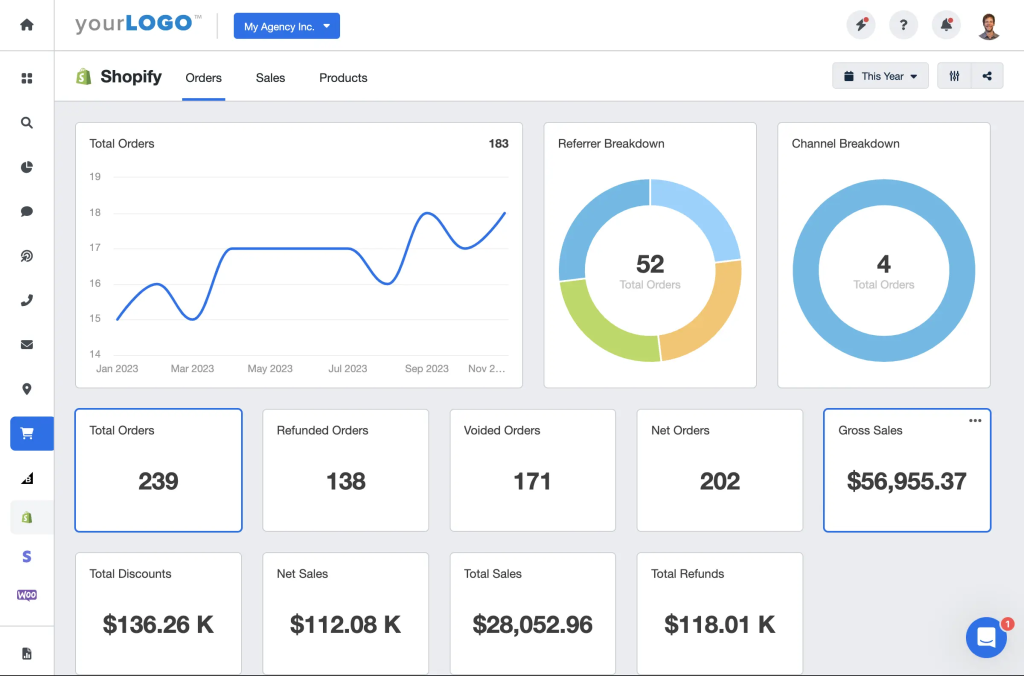
Your Shopify admin provides three primary analytical sections:
- Dashboards: Real-time overview of vital metrics
- Reports: Detailed performance analysis (available on Shopify Advanced plans and higher)
- Live View: Instant monitoring of current store activity
Essential Metrics for Beginners
Focus on these fundamental metrics from Shopify’s official reports documentation:
- Sessions Over Time: Track daily/weekly visitor trends
- Conversion Rate: Measure percentage of visitors making purchases
- Average Order Value (AOV): Monitor spending patterns
5 Must-Use Reports for New Store Owners
1. Acquisition Reports
Analyze traffic sources through the “Sessions by Referrer” report. This helps identify which marketing channels (social media, email campaigns, etc.) drive the most valuable traffic.
2. Customer Behavior Analysis
Use the “Top Online Store Searches” report to understand what products customers want but can’t find. Shopify’s data shows stores addressing these search gaps increase sales by up to 18%.
3. Financial Performance Reports
Track key metrics like:
- Gross profits
- Net sales
- Refund rates
4. Inventory Management Reports
Monitor stock levels and identify slow-moving products using Shopify’s inventory reports. This helps prevent stockouts and optimize purchasing decisions.
5. Custom Report Creation
Advanced users can create custom reports by:
- Navigating to Analytics > Reports
- Selecting “Create custom report”
- Choosing from 70+ pre-built templates
Pro Tips for Effective Analysis
- Set up Google Analytics for enhanced tracking
- Compare time periods (week-over-week/month-over-month)
- Use filters to isolate specific product/customer data
- Export reports to CSV for deeper analysis
When to Use Third-Party Tools
While Shopify’s native analytics work for most beginners, consider these popular apps as you scale:
| Tool | Best For |
|---|---|
| Google Analytics | Advanced traffic analysis |
| Klaviyo | Email marketing insights |
| TripleWhale | Omni-channel analytics |
Common Beginner Mistakes to Avoid
- Ignoring mobile performance metrics
- Not setting up conversion tracking
- Overlooking customer lifetime value (CLV)
- Failing to monitor cart abandonment rates
Start with Shopify’s official analytics guide to explore Shopify Reports & Analytics and allocate 30 minutes weekly to review reports. As eCommerce expert Neil Patel advises: “What gets measured gets improved.”
Ready to dive deeper? Explore our guide on advanced Shopify SEO strategies to complement your analytics efforts.


